Reference: delegate status and delegate watch
- NAME
- delegate-status, delegate-watch — show the state of a run
- SYNOPSIS
-
delegate status [<run-id>] [--repo <repo>] [--json]delegate watch [<run-id>] [--repo <repo>] [--until verdict] [--stall-minutes <n>] [--max-minutes <n>] [--from <position>] [--poll-seconds <n>] [--raw | --json]
delegate status and delegate watch show the state of a run. They read the journal of the run, and the event-stream files and the gate log files that the journal names. To find the active runs, they also read the lock of each run branch, and the run.log of a run directory that has no journal. status also reads the pause request in the directory of the run. They need no workflow file, and no tool beyond git, which finds the state directory. They do not need jq. status reads the event streams through the adapter of the run, for the tokens and the activity of each agent. It does not need the adapter: see a run with no stream reader. watch needs no adapter.
Both commands find the journal in the state directory of the repository, in runs/<run-id>/journal.jsonl. See the journal.
Each command takes the full run id, or its short id: the part after the last -, as abcd of 20261016T030000Z-abcd. When more than one run has the short id, the command does nothing. It prints an error that names each run with that short id, and exits 2.
Where the commands look for a run
With --repo, a command looks for the run only in the state directory of that repository. With a run id and no --repo, a command looks first in the state directory of the repository of the current directory. When the current directory is in no git repository, or that repository has no such run, the command looks in each state directory under the state root of this machine: DELEGATE_STATE_ROOT, or else $XDG_STATE_HOME/delegate (~/.local/state/delegate). Each repository has one directory there. So you can ask for a run of any repository from any directory. One match shows that run, as if --repo named its repository. When more than one run has the short id, the command exits 2, and the message names each full run id. When no run matches, the command exits 2, and the message names the state root. A run that started before #200 and is in <git common dir>/delegate is found only through --repo or from its repository. With no run id, the commands look only in the repository of --repo or of the current directory.
delegate status
status prints the state of the run once, and exits. To follow a run while it goes on, use delegate watch.
With no run id, status shows the one active run, or the newest run when no run is active. When more than one run is active, it prints the table of the active runs that the run picker of watch shows, with no prompt. See the run with no run id.
| Option | Meaning |
|---|---|
[<run-id>] |
The run to show; default is the one active run, or the newest run of the repository when no run is active. |
--repo <repo> |
The git repository that holds the run; default is the current directory, and a run id that is not found there is looked up under the state root. |
--json |
Print one snapshot of the run as JSON: the progress, the ETA, the tokens, and the activity of each agent. |
The first line gives the run id, the result, the mode, and the adapter. The result is running while a process works on the run and the journal has no run-end, and then built, failed or abandoned. A run that delegate clean --abandon ended is abandoned, and a note gives the reason: note: abandoned: the owner cancelled the work. A run with no run-end, no pause, no halt and no live process is stopped: see the stopped run. A run that ended and was resumed is running again: a run-end that a resume follows does not end the run. After delegate pause, the result is pausing while the request waits in the directory of the run and the run is active, and paused from the paused event until a resume. See the pause. A run that a failure of the harness stopped is halted from the halted event until a resume, and a note gives where and why: note: halted at the specialist of ticket b: claude: not logged in. See a failure of the harness. A run can stop before the engine reads the request: for example, after Ctrl-C, a kill or a crash. The request then stays until the next resume, and the run has no live process. Such a run is not pausing: the result is the state of its journal, for example stopped, and the note gives the command that goes on with it and says that the resume removes the request: note: no process works on the run; go on with delegate run --resume <run id>; the resume removes the pause request that waits. A paused run with a request that waits has the note note: a pause request waits; delegate run --resume removes it. The next line gives the progress of the run, and the line after it gives the path of the journal. Each stack-change adds a line that names the stack and the changed fields, and no value: stack python changed: gates, gate_timeout. Each retry with a new text adds a line kept: branch <name> holds the old work of ticket <ticket>, which a retry started again; delegate clean removes it. Under these lines and a blank line, a table has one row for each ticket of the run, in plan order. It is the ticket table of the live view of watch, on the same tracks, with three more columns: verdict and branch after after, and last event at the end. Each further phase of a running ticket is on a sub-row, as in the live view. status prints one snapshot, so the table has no live tail. The example below is the output for a locale that is not UTF-8, with the ASCII glyphs. With a UTF-8 locale, the same cells hold the glyphs of the live view:
run 20261016T030000Z-abcd: running (mode assure, adapter claude-code)
progress: 45%, 1 of 4 ended, 18m20s used, ETA 21m40s, tokens 58k new, 0 cache
journal /home/you/.local/state/delegate/repo-3f9a1c0b7d42/runs/20261016T030000Z-abcd/journal.jsonl

  #      plan    state     phase          after     verdict  branch              used    new   cache  last event
  1      * a     + built                            ACCEPT   run/demo-a        10m00s    39k       0  2026-10-16T03:10:00+00:00
  2  |   > b     running   specialist +                      run/demo-b         8m20s    19k       0  2026-10-16T03:16:00+00:00
     |                     gates +
     |                     verifier *
     |                     fix-up o
  3  |   . c     pending
  4      . d     pending
On a terminal with a UTF-8 locale, the table has the glyphs and the colours of the live view, as in the figure below. The text under the figure is the same output with no colour.
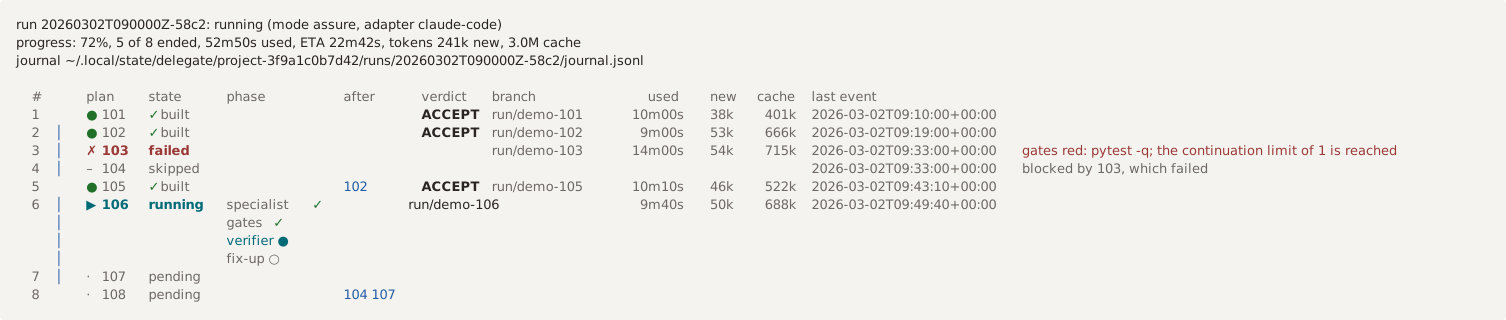
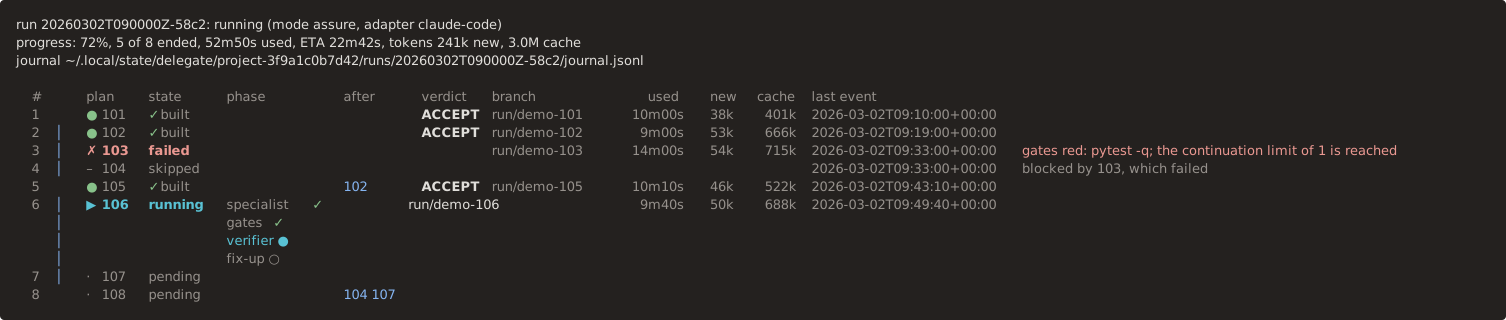
run 20260302T090000Z-58c2: running (mode assure, adapter claude-code)
progress: 72%, 5 of 8 ended, 52m50s used, ETA 22m42s, tokens 241k new, 3.0M cache
journal ~/.local/state/delegate/project-3f9a1c0b7d42/runs/20260302T090000Z-58c2/journal.jsonl

  #      plan    state     phase          after     verdict  branch              used    new   cache  last event
  1      ● 101   ✓ built                            ACCEPT   run/demo-101      10m00s    38k    401k  2026-03-02T09:10:00+00:00
  2  │   ● 102   ✓ built                            ACCEPT   run/demo-102       9m00s    53k    666k  2026-03-02T09:19:00+00:00
  3  │   ✗ 103   failed                                      run/demo-103      14m00s    54k    715k  2026-03-02T09:33:00+00:00  gates red: pytest -q; the continuation limit of 1 is reached
  4  │   – 104   skipped                                                                              2026-03-02T09:33:00+00:00  blocked by 103, which failed
  5      ● 105   ✓ built                  102       ACCEPT   run/demo-105      10m10s    46k    522k  2026-03-02T09:43:10+00:00
  6  │   ▶ 106   running   specialist ✓                      run/demo-106       9m40s    50k    688k  2026-03-02T09:49:40+00:00
     │                     gates ✓
     │                     verifier ●
     │                     fix-up ○
  7  │   · 107   pending
  8      · 108   pending                  104 107
The progress line comes from the snapshot, and follows the rules of the progress and the ETA. It gives the percentage, the tickets that ended, the time used, the ETA, and the tokens as tokens <new> new, <cache> cache. See the token counts. The ETA is the time from now, or - before the first ticket ends and while the run is later than its estimate. A run that ended or paused shows no ETA. In economy mode, while the verification of the chain runs, the line starts with its phase. For example: progress: verifier, 66%, 2 of 2 ended, 16m40s used, ETA 5m51s, tokens 39k new, 1.2M cache.
The columns of the table:
| Column | Meaning |
|---|---|
# |
The position of the ticket in the plan. |
| (no header) | The rail │ when the one blocker of the ticket is the row directly above, as in the live view. |
plan |
The node glyph of the state, and the id of the ticket, as in the live view. |
state |
pending (no event yet, or an unskip event after the skip: a resume takes the ticket out of the skipped tickets), running (step-start, and no step-end; or a retry after the step-end), built, failed, or skipped. |
phase |
For a running ticket, the first phase on its row, and each further phase on a sub-row, as in the live view: ✓ for a phase that is done, ● for the phase that runs, and ○ for a phase that is to come. Only phases go in this column. |
after |
The ids of the blockers of the ticket when the rail does not join it to its blocker, as in the live view. |
verdict |
The verdict of the newest verdict event of the ticket. Empty when there is none. A verdict of a chain in economy mode covers each ticket in its tickets field. |
branch |
The branch of the ticket, from step-start. Empty when the ticket has no step. |
used |
The time that the ticket used. Empty when the ticket has no step. |
new, cache |
The two token counts of the ticket. Empty when the ticket has no step, or has a stream that cannot be read. For a run with no stream reader, the table has no such columns. |
last event |
The time of the newest event of the ticket, as the journal records it (ISO 8601, UTC). Empty when there is none. |
| (no header) | For a ticket that failed or was skipped, the reason, with no path. The reason of a crash in a journal of version 1.19.2 or earlier ends with (traceback <path>): the whole path of the file that holds the traceback (the traceback of its step-end). A crash now leaves the step open, and the note of the run gives the crash. In a paused run, the row of the ticket that the pause stopped before gives paused before this step, paused before the gate or paused before the verifier. status has no live tail: the activity of an agent and the gate that runs are in the snapshot (idle_seconds, gate, gate_idle_seconds). |
Each column has the width of its track in the design: # 3 cells, the rail 2, plan 6, state 8, phase 13, after 8, verdict 7, branch 15, used 7, new 5 and cache 6. A column with a value that is wider than its track is as wide as its widest value. last event and the reason have no track. There are 2 cells between two columns. The numbers, and the headers #, used, new and cache, align right in their track. status does not cut a line to the width of the terminal, and drops no column. On a terminal, each cell of the table has the colour of its role, as in the live view, and the verdict word is bold. The header lines have no colour. When NO_COLOR is set and not empty, or when standard output is not a terminal, the output has no SGR code. The text of status is for a person, and it can change in a later version. A program reads status --json: see the snapshot.
On a terminal, status sets the title of the terminal to delegate status. See the terminal title.
status exits 0 when it printed the run, the table of the active runs, or the line of a newest run that failed at start. It exits 2 when the path is not a git repository, when the repository has no run, when the run id is unknown, when more than one run has the short id, when a lock file cannot be read, when the journal is not valid, or with --json and no run id when more than one run is active or the newest run failed at start. The message on stderr names the repository, the run id, the journal, each active run, or the run that failed at start. Ctrl-C ends status with the code 130 and the line delegate: interrupted on stderr, and with no traceback. With no run id, a journal that cannot be read does not stop the command: it skips that journal, names it on stderr (delegate status: skipped the journal <path>: <reason>), and shows the other runs. watch with no run id does the same. When no journal can be read, the command exits 2. An event stream that cannot be read is not an error: see a stream that cannot be read.
The snapshot
status --json prints one snapshot of the run as one JSON object. Two plugins read it, so the fields below are a contract. A new field can come in a later version. A field does not change its type or its meaning. One exception is in the changelog: the fields tokens_new and tokens_cache replace the field tokens of version 1.2.0, for the run and for each ticket.
| Field | Type | Meaning |
|---|---|---|
run_id |
string | The id of the run. |
state |
string | running while a process works on the run and the journal has no run-end, then the result of the run: built, failed or abandoned. stopped when the journal has no run-end, no pause and no halt, and no live process works on the run: see the stopped run. pausing while a pause request waits and the run is active, and paused from the paused event until a resume. halted from the halted event until a resume: a failure of the harness stopped the run, and note gives the role, the ticket and the message. See the pause and a failure of the harness. A pause request of a run with no live process does not make the run pausing: see note. |
time |
string | The time of the snapshot (ISO 8601, UTC, whole seconds). For a run that ended, it is the time of run-end: the clock of the run stops there. For a paused run, it is the time of paused, for a halted run, the time of halted, and for a stopped run, the time of its newest event. |
elapsed_seconds |
integer | The time that the run used: from run-start to time. |
tickets_total |
integer | The number of tickets of the run. |
tickets_ended |
integer | The number of tickets that ended: built, failed, or skipped. |
percent |
integer | The part of the run that is complete, from 0 to 100. See the progress and the ETA. |
eta |
string or null |
The estimated time of the end of the run (ISO 8601, UTC), or null before the first ticket ends, while a unit of the run still runs and the estimate is 0 or less, and while the run is paused, halted or stopped. See the progress and the ETA. |
tokens_new |
integer or null |
The new tokens of the run: the sum of tokens_new of all tickets. A ticket whose tokens_new is null adds nothing. null for a run with no stream reader. See the token counts. |
tokens_cache |
integer or null |
The cache tokens of the run: the sum of tokens_cache of all tickets. A ticket whose tokens_cache is null adds nothing. null for a run with no stream reader. |
phase |
string or null |
In economy mode, while the verification of the chain runs: its phase, gates, verifier or fix-up. See the verification of an economy chain. null before the verification starts, after run-end, while the run is paused, and in assure mode. |
note |
string or null |
For a stopped run: no process works on the run; go on with delegate run --resume <run id>, and ; the resume removes the pause request that waits when a pause request waits in the directory of the run. a pause request waits; delegate run --resume removes it when a pause request waits and the run is paused or ended and not active. For a halted run, the place and the message of the halt. For a stopped run that a crash stopped, the text of the crash and the resume command (see the stopped run). For an abandoned run, abandoned: <reason>. For a run that cannot be resumed, cannot be resumed: <reason>; start a new run. null otherwise. |
tickets |
list of objects | One object for each ticket, in plan order. See the table below. |
plan |
list of objects or null |
The newest plan of the run: one object for each ticket, in plan order, with its id (string) and its blocked_by (list of strings), the ids of its blockers as the plan field of run-start or of the newest plan-change records them. A blocker that is not in the plan can be in the list. null for the journal of an earlier version of the engine, which records no plan. |
chains |
list of objects | One object for each stack that started the verification of its chain, in the order of the first event of the verification. See the chain row. An empty list in assure mode, and before the first verification starts. |
| Ticket field | Type | Meaning |
|---|---|---|
id |
string | The id of the ticket. |
state |
string | pending, running, built, failed, or skipped, as in the table of status. |
phase |
string or null |
For a running ticket, the phase of its step: specialist, gates, verifier, or fix-up. null for a ticket that does not run. |
elapsed_seconds |
integer | The time that the ticket used: from its first step-start to its step-end, or to time while it runs. After a retry, the time goes on to the next step-end. 0 for a ticket with no step. |
tokens_new |
integer or null |
The new tokens of all agents of the ticket: the input, the cache writes, and the output of each specialist run, each fix-up specialist, and each verifier. In economy mode, the verifier of a chain counts for the last ticket of its stack. null for a run with no stream reader, and for a ticket with a stream that cannot be read. See the token counts. |
tokens_cache |
integer or null |
The cache reads of the same agents. It is null when tokens_new is null. |
idle_seconds |
integer or null |
While an agent of the ticket runs: the seconds from the newest event of its stream to time. The time of that event comes from the adapter. When the newest event has no time of its own and shows that the agent works (for example, a tool heartbeat of Claude Code), the time is the modification time of the stream file. See the newest activity. When the stream has no event with a time yet, the seconds from its agent-start. null when no agent of the ticket runs, for example in the gates phase. An agent runs from its agent-start until its result event, a step-end, run-end, or paused. The verifier of a chain runs after its ticket ended, so a ticket that ended can show it. null for a run with no stream reader, and when the stream of the agent that runs cannot be read. |
gate |
string or null |
While a gate of the ticket runs: the gate command, from its gate-start. A gate runs from its gate-start until its gate-result, a step-end, run-end, or paused. The gates of the phase gates and the gates of a fix-up round both show. null when no gate of the ticket runs. |
gate_idle_seconds |
integer or null |
While a gate of the ticket runs: the seconds from the last change of its log file (the gate_log of its gate-start) to time. The gate runner appends the output of the gate to the log while the gate runs. null when no gate of the ticket runs, and when the log file is missing or cannot be read. It needs no stream reader. |
The phase of a running ticket follows its newest event:
| Event | Phase |
|---|---|
step-start, continuation, or agent-start with the role specialist |
specialist |
report-validation that is valid, rebase, or gate-start, gate-result or gate-skip of the phase build or rebase |
gates |
verify-start, or agent-start with the role verifier |
verifier |
fixup-start, or agent-start with the role fix-up |
fix-up. The gates of a fix-up round of assure mode stay in the phase fix-up. |
The two token counts and the time of the newest event come from the method activity of the adapter of the run. See the adapter interface, and the activity of the claude-code adapter and the opencode adapter.
The token counts
status shows two token counts, for the run and for each ticket, in each form: the progress line and the ticket table of status, the JSON, and the run line, the ticket table and the feed of the live view of watch. It shows no cost.
- New (
tokens_new): the input tokens, the cache writes, and the output tokens, with the thinking tokens. These are the tokens that the model reads or writes for the first time. - Cache (
tokens_cache): the cache reads. Each turn of an agent reads its whole context again from the cache, so this count grows with the number of turns times the size of the context. A long session has many cache reads, and they do not mean that the run is expensive.
The progress line of status gives the two counts in a short form: tokens 302k new, 9.7M cache. The feed of watch uses the same form. The ticket tables give each count in its own column, in the same short form: 302k and 9.7M. A count under 1000 shows as it is, a count under one million shows in thousands (k), and a larger count shows in millions (M) with one decimal.
Each adapter splits the counts of its stream:
| Adapter | New | Cache |
|---|---|---|
claude-code |
input_tokens, cache_creation_input_tokens, and output_tokens of a usage object |
cache_read_input_tokens of a usage object |
opencode |
input, output, reasoning, and cache.write of the part.tokens of a step_finish event |
cache.read of the part.tokens of a step_finish event. A step with no cache field gives 0. |
Where the counts come from:
- An agent that ended. The engine wrote the counts of its stream into its result event (
adapter-result,fixup-resultorverify-result) when its session ended.statusandwatchtake the counts from the journal. They do not read the stream, so they show the same counts after the stream file is deleted. See the totals of an agent that ended. - An agent that runs now.
statusandwatchread its stream. The live view ofwatchkeeps the last result for each stream, with the size and the modification time of the file, and it parses the stream again only when one of the two changes. A frame costs no parse for a stream that did not change. - A journal from an earlier version. Its result events have no counts.
statusandwatchthen read the stream, as they did before.
The token counts of a claude-code stream:
- The counts of one turn or one session come from its
usageobject, as the table above gives. - When the stream holds a
resultevent, the counts of that session are theusageof theresultevent. Theusageof anassistantevent is partial, so it does not give the counts of a session that ended. - For a session that has no
resultevent yet (an agent that runs now), the counts are the sums of its turns: one turn for eachmessage.id, with the newest usage of that message. - A resumed session writes its events in the same stream, after the
resultevent of the earlier session. The counts of the stream add the counts of each session. The streams are the files thatagent-startand the result events name. The stream of an agent that runs now can be missing for a short time, before the harness opens it: it then has 0 new tokens and 0 cache tokens. Any other stream that is missing is a stream that cannot be read.
The newest activity
An agent can work for a long time and write no event with a time. For example, Claude Code writes a tool_progress heartbeat every 30 seconds while a long command runs in the foreground, and thinking_tokens events while the model thinks. These events have no timestamp field. The rule: when the newest event of the stream has no time and shows work, the time of the newest activity is the modification time of the stream file. So the last activity of an agent that runs a long command is never more than about 30 seconds old, and does not look like a stall. The stall check of watch also uses the modification time of the stream, so the two agree.
A run with no stream reader
The status process can have no reader of the streams of a run:
- The adapter of the run is not known to the process. For example, a script registered the adapter in its own process.
- The adapter has no method
activity. For example, an adapter of an earlier version.
Each form of status then works, and exits 0. It shows the progress and the ETA. It shows no tokens and no activity: in the JSON, tokens_new, tokens_cache and idle_seconds are null, and the ticket table of status and of the live view of watch has no columns new and cache. The live view has no activity in the live tail. status does not read the streams of such a run. The running gate and the time since its log changed do not need the reader, so they show in the JSON and in the live view.
A stream that cannot be read
status only shows data. Each form of status works, and exits 0, when an event stream of the run cannot be read. The rule: any error from the check that the stream exists, or from the method activity of the adapter, makes that stream a stream that cannot be read. For example, a stream cannot be read when:
- The file is missing. The stream of an agent that runs now is the exception: before the harness opens it, it has 0 tokens.
- The process cannot search a parent directory of the file.
- The process cannot read the file, for example because the file has no read permission.
- The path is a directory.
- The file is not UTF-8 text.
- A line before the last one is not JSON.
- A line is JSON, but it is not an event that the adapter can use. For example, a line is a number or a list, a
timestampis not a time, a usage value of aclaude-codestream is not a number, or astep_finishevent of anopencodestream has nopart.tokens.inputnumber.
status then shows no tokens and no activity for that agent:
- In the JSON, the
tokens_newand thetokens_cacheof its ticket arenull. The counts of the other agents of the ticket would not be the counts of the ticket. - When the agent runs now, the
idle_secondsof its ticket isnull. - The
tokens_newand thetokens_cacheof the run are the sums of the other tickets. - The row of the ticket in the table of
statusand in the live view ofwatchshows no tokens for the ticket. While the agent runs, the live view shows no activity for it.
Only status treats such a stream as no data. delegate run reads the stream of an agent for its end state, and a stream that it cannot read stays an error there.
The progress and the ETA
The percentage:
- A ticket that ended (
built,failed, orskipped) counts 1. - A running ticket counts by its phase:
specialist0,gates0.6,verifier0.8,fix-up0.8. The verification of aneconomychain counts by its phase in the same way. - A pending ticket counts 0.
- The percentage is the sum, divided by the number of units, times 100, rounded down. A unit is a ticket. In
economymode, the verification of the chain is one more unit. See the verification of aneconomychain.
The ETA:
- Before the first ticket ends, the ETA is
null. - After that, the ETA is
time+ M × N − R. M is the mean duration of the ended tickets. N is the number of units that did not end. R is theelapsed_secondsof the running ticket, and the time that the verification of aneconomychain used. - The mean uses the tickets that ended after a step (
builtorfailed). A skipped ticket has no step and no duration, so it does not count in the mean. It counts as ended. - The ETA is never earlier than
time. For a run that ended, it is the time ofrun-end. - The ETA never shows
0swhile a unit of the run still runs. A unit runs when a ticket runs, or when the verification of aneconomychain runs. When the estimate is 0 or less and a unit runs, the ETA isnullin the JSON and-in each line: the run is later than its estimate, and the estimate does not know the end. The ETA of a run with no unit that runs, for example between two steps, is still the estimate, and it can betime.
The verification of an economy chain
In economy mode the verification of the chain runs after the last ticket ends: the gates on the chain tip, the verifier, and the fix-up rounds. For the percentage and the ETA, the verification, with its gates, is one more unit of the run, as a ticket is:
- While the verification runs, it counts by its phase, as a running ticket does:
gates0.6,verifier0.8,fix-up0.8. Before it starts it counts 0. Afterrun-endit counts 1. Thus the percentage stays below 100 until the run ends. - The verification starts at the first
gate-startorgate-skipof the phasechain, or at the firstverify-startwhen the journal holds no such gate event. While it runs,phaseof the snapshot follows the newestgate-startorgate-skipof the phasechain(gates),verify-start(verifier), orfixup-start(fix-up). After a fix-up round the gates of the chain run again, so the phase isgatesagain. - The ETA estimates the verification as one mean ticket: M. R holds the time from the start of the verification to
time. - The tickets of the chain stay
built, with thephasenull. The last ticket of each stack shows the tokens and theidle_secondsof the verifier of its stack.
For example, two tickets of 600 and 300 seconds ended, and the gates of the chain started 99 seconds ago. The percentage is (2 + 0.6) ÷ 3 × 100, rounded down: 86. The ETA is time + 450 × 1 − 99. When the gates have run for 450 seconds or more, the estimate is 0 or less and the ETA is -.
The chain row
The verification of a chain is also a row of the ticket table, in delegate status and in the live view of delegate watch. A gate of the chain can run for hours, and a table with only built rows would not show it. In economy mode, the table has one chain row for each stack that started its verification. The row starts at the first gate, verifier or fix-up of the chain of the stack. A retry at the phase chain-fixup does not end the row: the chain goes on in the phase fix-up, with its round and its time from before the retry. It goes after the last ticket row of the stack, under the sub-rows of that ticket, and it folds with that ticket when the rows fold to fit the height of the terminal. A run in assure mode has no chain row, and --raw does not change.
| Cell | The chain row |
|---|---|
plan |
The name of the stack, with the node glyph of the state. |
state |
running while the chain of the stack runs, then accepted when its verifier gave ACCEPT, or rejected when it ended without that verdict: a REJECT with no fix-up round left, red gates after the last round, or a crash. A run that ended with no ACCEPT also shows its running chain as rejected. |
phase |
While the chain runs: gates ●, verifier ● or fix-up ● <round>/<limit>. Empty after the chain ended. |
verdict |
In delegate status, the verdict that ended the chain (ACCEPT or REJECT). The live view has no such column, and gives verdict <verdict> in its live tail. |
used |
The time from the start of the verification of the stack to now, or to its end. |
new, cache |
The tokens of the agents of the chain: its verifier and its fix-up specialist. The same tokens are in the row of the last ticket of the stack. The run line counts them once. |
| live tail | In the phase gates: gate <name> · log <time> ago, the gate command and the age of its log, with ⚠ idle <time> past the stall time. In the phases verifier and fix-up: the liveness of the agent. delegate status has the same text, as a snapshot. |
The chains list of status --json has one object for each chain row:
| Chain field | Type | Meaning |
|---|---|---|
stack |
string | The name of the stack. |
phase |
string or null |
gates, verifier or fix-up while the chain runs. null after it ended. |
state |
string | running, accepted or rejected. |
elapsed_seconds |
integer | The time that the verification of the stack used: from its first event to time, or to its end. |
gate_command |
string or null |
While a gate of the chain runs: its command, from its gate-start. null otherwise. |
gate_idle_seconds |
integer or null |
While a gate of the chain runs: the seconds from the last change of its log file to time. null when no gate runs, and when the log file is missing or cannot be read. |
tokens_new |
integer or null |
The new tokens of the agents of the chain. null for a run with no stream reader, and for a chain with a stream that cannot be read. |
tokens_cache |
integer or null |
The cache reads of the same agents. It is null when tokens_new is null. |
verdict |
string or null |
The verdict that ended the chain. null while it runs, and when red gates ended it. |
fixup_round |
integer | The round of the newest fix-up of the chain, or 0 before the first fix-up. A retry at the phase chain-fixup does not start the count again: the engine counts the fix-up rounds since the last retry that is not at that phase, and status and watch use the same rule. A retry at another phase starts the chain again. |
delegate watch
delegate watch [run-id] [--repo <dir>] [--until verdict] [--stall-minutes N] [--max-minutes N] [--from <position>] [--poll-seconds N] [--follow] [--raw | --json]
watch follows the run: it reads the journal at each poll, shows each new event, and exits when it has a reason. When a run is active, the live view always follows it: a problem does not end it, and it exits only when the run ends or stops, or at a limit that the person sets. The raw lines and the JSON lines are for agents: they end at a new problem, unless --follow is set. The form of the output depends on standard output:
- When standard output is a terminal,
watchshows the live view: the run line and a table of the tickets at the top, and below them a short line for each event of the ticket that runs now. - When standard output is not a terminal, or with
--raw,watchprints the raw lines: one line for each event. A coordinator can runwatchas a background task, read the lines, and act on the exit code. - With
--json,watchprints the JSON lines: one JSON object on one line for each event. A script reads the objects and needs no other tool than a JSON reader.--jsonand--rawcannot be used together: the parser refuses both and exits 2.
The exit codes and the options are the same in the three forms, except that a problem ends the watch only in the raw lines and the JSON lines, and only without --follow. See the exit codes. The last line position <seq> is the same in the two forms that print text; --json prints no such line. The position is the seq of the last event that watch reported.
With no run id, watch follows the one active run of the repository, also with --from. When no run is active, it prints one line for the newest run, and no event. With --from, it replays the journal of the newest run from the position. When more than one run is active, it shows the run picker on a terminal. Otherwise it prints one line on stderr that names each active run, follows none, and exits 2. See the run with no run id.
On a terminal, watch also shows the progress of the run in the title of the terminal, in the two forms. See the terminal title.
| Option | Meaning |
|---|---|
[<run-id>] |
The run to follow; default is the one active run, or the newest run of the repository when no run is active. |
--repo <repo> |
The git repository that holds the run; default is the current directory, and a run id that is not found there is looked up under the state root. |
--until verdict |
Also exit when a verifier verdict is written to the journal; default is to follow the run to its end. |
--stall-minutes <n> |
Exit when the journal, the captured event streams and the gate logs have not changed for N minutes; N is a number greater than 0. |
--max-minutes <n> |
Exit after N minutes, before a harness time limit, and print the position to go on from; N is a number greater than 0. |
--from <position> |
Go on after the event with this position, which an earlier watch printed; no event is reported twice. |
--poll-seconds <poll-seconds> |
How often to read the journal; default 1. |
--follow |
Do not exit at a problem: with --raw, --json or no terminal, follow the run as the live view does, to its end; the live view always does. |
--raw |
Print the raw line of each event, as to a standard output that is not a terminal; default on a terminal is the live view. |
--json |
Print each event as one JSON object on one line, and a last object for a reason of the watch to end; cannot be used with --raw. |
The run with no run id
status and watch with no run id choose the run from the active runs of the repository. watch uses this rule also when it gets --from, so watch --from <position> with no run id follows the same run as watch with no run id. When no run is active, watch with --from replays the journal of the newest run from the position, and does not print the one line of the newest run.
A run is active when these two conditions are true:
- Its journal has no
run-endafter its newestresume. This is the rule of the state ofstatus: a run that ended and was resumed works again. - A process holds the lock of its run branch, and the lock file names the run. This is the lock check of
delegate runanddelegate pause. See the run lock.
A run with no run-end and no live process is not active: its process stopped. A crash, a kill, Ctrl-C, a stop of the machine and a pause stop the process of a run.
The stopped run
status shows a run as stopped when its journal has no run-end after its newest resume, it is not paused or halted, and no process holds a lock of its run branch whose file names the run. A crash, a kill, a stop of the machine, and Ctrl-C, SIGTERM or SIGHUP (the journal then holds interrupted) leave a run so. The first line is run <run id>: stopped (...), and the line after it gives the note note: no process works on the run; go on with delegate run --resume <run id>. --json gives the state stopped and the same text in note. A stopped run that cannot be resumed (#358) gets the note cannot be resumed: <reason>; start a new run. An example is a kill between invariant-violation and run-end. A run whose newest crashed event comes after its newest resume is stopped too, also before its process released the lock (#281). Its note gives the crash and the resume command: note: crashed at <where>: <exception type>: <message> (traceback <path>); go on with delegate run --resume <run id>. See a crash in a step. The clock of a stopped run stops at its newest event, and the snapshot has no ETA. A run whose lock holder is alive is running, as before. A lock file that cannot be read does not show that the process stopped, so the run is then running. delegate watch follows the same rule.
A run directory with a run.log and no journal is the directory of a detached run whose journal does not exist. When a process holds a lock whose file names its run id, the run process works, and it has not written its journal yet. When its log is empty, the run process has not written to it yet. Otherwise the run failed at start. A run that failed at start has no run-start event, so the time of the last change of its log is its start time when the commands find the newest run.
| Active runs | status |
watch |
|---|---|---|
| One | Shows the active run, also when a newer run ended. | Follows the active run, also when a newer run ended. |
| None | Shows the newest run. When the newest run failed at start, prints its line, and exits 0. With --json, it exits 2, and the message is the line. |
Prints one line for the newest run, and exits. With --from, replays the journal of the newest run from the position, when that run has a journal. With --json, replays the journal of the newest run, also with no --from: see the JSON lines. See the newest run that ended, the newest run that stopped and the newest run that failed at start. |
| More than one | Prints the table of the active runs, with no prompt, and exits 0. With --json, it exits 2, and the message names each active run. |
On a terminal, shows the run picker, and follows the run that you choose. Otherwise, prints one line on stderr that names each active run, follows none, and exits 2. |
The run picker
When watch gets no run id, more than one run is active, and standard input and standard output are terminals, watch shows the run picker. It shows the run picker also with --from, and goes on from the position in the run that you choose. It prints the number of the active runs, a table with one row for each active run, the newest run first, and the prompt watch which? [1]. The example below is for a locale that is not UTF-8, with the ASCII glyphs. With a UTF-8 locale, the same cells hold · (the separator) and ▶ (a running ticket):
2 runs are active in this repository
#  run                    run branch    mode     since  progress          now
1  20261019T051148Z-ff1a  run/fix-auth  economy  18:11  0/1 ended . 30%   > 12 gates . active 12s ago
2  20261019T040911Z-d636  run/plan      assure   17:09  6/13 ended . 46%  > 7 specialist . active 1m05s ago
watch which? [1]
On a terminal with a UTF-8 locale, the picker has the glyphs and the colours of the figure below, here with three active runs. The text under the figure is the same output with no colour.


3 runs are active in this repository
#  run                    run branch     mode     since  progress         now
1  20260302T090500Z-c3e8  run/cli-flags  assure   09:05  0/3 ended · 0%   ▶ 401 specialist · active 1m00s ago
2  20260302T084000Z-9a0b  run/docs-pass  economy  08:40  2/5 ended · 33%  paused · no ticket running · active 12m00s ago
3  20260302T081500Z-2d4f  run/parser     assure   08:15  4/9 ended · 53%  ▶ 205 verifier · active 3m10s ago
watch which? [1]
Type the number of a run, and push Enter. Enter alone takes 1, the newest run. watch then follows that run, as it follows a run that you name. An answer that is not the number of a row gets one line on stderr, and the prompt again. At the end of the input (Ctrl-D), watch follows no run, and exits 2. Ctrl-C at the prompt prints delegate: interrupted on stderr, and watch exits 130. See Ctrl-C.
status with no run id prints the same lines, with no prompt, and exits 0. It does not ask, so a script can read it. The columns of the table:
| Column | Meaning |
|---|---|
# |
The number to type at the prompt. |
run |
The run id. On a terminal, its short id is bold. |
run branch |
The run branch of the run. |
mode |
The mode of the run. |
since |
The local time of the run-start event. A run that did not start today also has the day of the week, as Mon 17:09. |
progress |
The tickets that ended, of all the tickets, and the percentage of the snapshot. |
now |
Each running ticket and its phase, separated by ,. While the verification of an economy chain runs, chain <phase>. When no ticket runs, no ticket running. Before them, the state of a run that is not running, as pausing. Then active <time> ago: the time since the newest change of the journal, of the event streams, of the gate logs and of the prepare logs that the journal names. The stall check of watch uses the same files. |
When standard input or standard output is not a terminal, nobody can answer the prompt, for example a coordinator that runs watch as a background task. watch then follows no run. It prints one line on stderr that gives each active run, the newest run first, with its run branch and its state, and it exits 2:
delegate watch: 2 runs are active in this repository; give a run id: 20261019T051148Z-ff1a (run/fix-auth, running), 20261019T040911Z-d636 (run/plan, running)
watch replays no event, and prints no line position <seq>. Give the run id, or its short id, to follow one of the runs.
The newest run that ended
When watch gets no run id and no --from, no run is active, and the newest event of the journal of the newest run is run-end, watch shows no event of that run. It prints one line, and no line position <seq>:
no run is active; the newest run 20261016T030000Z-abcd ended failed at 2026-10-16 17:06; first problem: ticket a: the step failed: no commit
The line gives the run id, the result, and the local date and time of the newest run-end event. When the run failed and its journal holds a problem, the line also gives the ticket and the reason of the first problem. Then watch exits with the code of the result: 0 for built, and 1 for failed. See the exit codes. The line has the same words on a terminal and with --raw, and watch draws no live view. On a terminal, the result is bold and has the colour of its role: built is green and failed is red. The time is faint, and the first problem is red. A paused run has paused in yellow. An error line of watch on stderr is red when stderr is a terminal. When NO_COLOR is set and not empty, when the stream is not a terminal, or with --raw, the lines have no colour code. With --raw, the lines are the same as before the colours.
A retry continues a run that ended: the journal gets retry, then a new step-end and a new run-end, and the newest of each wins, as for delegate status. While a retry goes on, an event follows the newest run-end, so the run is active, and watch follows it. When watch follows or replays a journal, a run-end that another event follows does not end the watch. An event of a ticket that a later retry of the same ticket follows is no problem: the retry continues the step of that ticket. The first problem of the line is the first problem that is not before a retry of its ticket.
To see the events of a run that ended, give its run id or --from. watch then replays the journal, as it does for a run that goes on. When the repository has no run, watch exits 2.
The newest run that stopped
When watch gets no run id and no --from, no run is active, and the newest event of the journal of the newest run is not run-end, the process of that run stopped. watch shows no event of that run, and it prints no line position <seq>. It prints one line that tells how to go on with the run:
- When the run is paused, the line goes to stdout, and
watchexits 7. A run is paused when its newestpausedevent comes after its newestresume, as forstatus. - When the run is halted, the line goes to stdout, and
watchexits 8. A run is halted when its newesthaltedevent comes after its newestresume. The line gives the message of the failure of the harness. - When a crash stopped the run, the line goes to stdout, and
watchexits 8, the code of a halt. A run crashed when its newestcrashedevent comes after its newestresume. The line gives the text of the crash, as the note ofstatusgives it. - When the check of the setup stopped the run, the line goes to stderr, and
watchexits 2. The line gives the problems, and the command that goes on once the setup is right. A run is stopped so when its newestsetup-problemevent comes after its newestresume. Awatchthat follows the run ends at that event, with the same code, and prints the same line on stderr. - When the run stopped in a different way, for example after a kill, the line goes to stderr, and
watchexits 2: there is no run to follow.
no run is active; the newest run 20261016T030000Z-abcd paused at 2026-10-16 17:06; go on with delegate run --resume 20261016T030000Z-abcd
no run is active; the newest run 20261016T030000Z-abcd halted at 2026-10-16 17:06: claude: not logged in; go on with delegate run --resume 20261016T030000Z-abcd
no run is active; the newest run 20261016T030000Z-abcd stopped at 2026-10-16 17:06: crashed at the specialist of ticket a: EngineError: fatal: Unable to create 'index.lock': File exists (traceback /home/you/.local/state/delegate/repo-3f9a1c0b7d42/runs/20261016T030000Z-abcd/crash-6.txt); go on with delegate run --resume 20261016T030000Z-abcd
delegate watch: no run is active; the newest run 20261016T030000Z-abcd stopped at 2026-10-16 17:06 with no run-end, and no process works on it; go on with delegate run --resume 20261016T030000Z-abcd
The line gives the run id, the local date and time of the newest event of the journal, and the command that resumes the run. See the resume.
The newest run that failed at start
When status or watch gets no run id, no run is active, and the newest run failed at start, the run has no journal. The command prints one line on stdout, and no line position <seq>:
no run is active; the newest run 20261019T070133Z-b937 failed at start: delegate run: git branch run/watch-chain e0dbee4 failed: fatal: a branch named 'run/watch-chain' already exists; log /home/you/.local/state/delegate/repo-3f9a1c0b7d42/runs/20261019T070133Z-b937/run.log
The line gives the run id, the last line of the log that holds text, and the path of the log. In the example, another process made the run branch after the checks of the run. watch exits 1: the run failed. status exits 0. With --json, status exits 2, and the message on stderr is the line: the run has no snapshot. Since delegate run --detach makes the checks that need no agent before it starts the run process, a run fails at start only after those checks.
The live view
On a terminal, watch draws a frame at each poll, in place of the frame before it. The frame has the run line, a blank line, the ticket table, a divider, and the feed of the ticket that runs now. The example below is the frame for a locale that is not UTF-8, with the ASCII glyphs. With a UTF-8 locale, the same cells hold the glyphs █ ░ (the bar), ● ▶ · ✗ – (the nodes), │ (the rail), ✓ ● ○ (the phases) and ─ (the divider):
run abcd  running  #############... 82%  5/7 ended  58m20s used  ETA 11m40s  213k new . 0 cache

  #      plan    state       phase          after        used    new   cache
  1      * 66    + built                               10m00s    39k       0
  2  |   * 72    + built                               10m00s    39k       0
  3  |   * 67    + built                               10m00s    39k       0
  4      * 68    + built                               10m00s    39k       0
  5      * 69    + built                               10m00s    39k       0
  6  |   > 70    running     specialist +               8m20s    19k       0  quiet 2m20s
     |                       gates +
     |                       verifier *
     |                       fix-up o
  7  |   . 71    pending
------------------------------------------------------------------------------------------------------------------------
16:50  #70  started · python-specialist
16:55  #70  specialist finished · 5m · tokens 19k new, 0 cache · report ok
16:56  #70  gates green (pytest 1m)
16:56  #70  verifier started
16:58  #70  verifier running · 2m · 0 new · 0 cache · quiet 2m20s
The figure below is a frame on a terminal with a UTF-8 locale, at 120 columns. The text under the figure is the same frame with no colour.
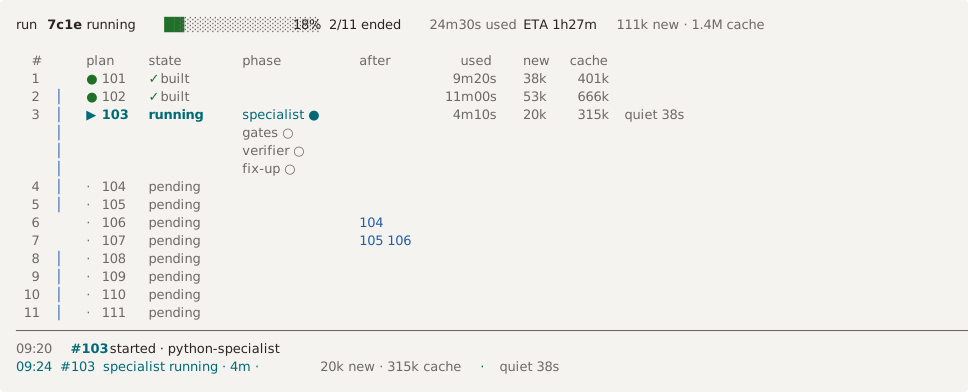
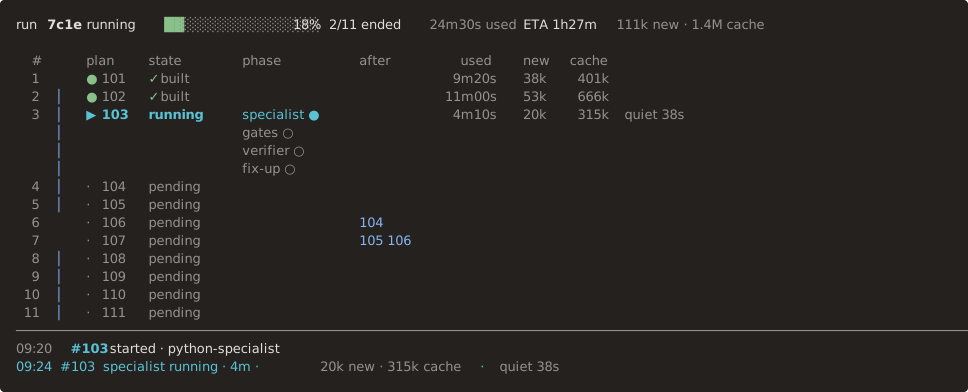
run 7c1e  running  ██░░░░░░░░░░░░░░ 18%  2/11 ended  24m30s used  ETA 1h27m  111k new · 1.4M cache

  #      plan    state       phase          after        used    new   cache
  1      ● 101   ✓ built                                9m20s    38k    401k
  2  │   ● 102   ✓ built                               11m00s    53k    666k
  3  │   ▶ 103   running     specialist ●               4m10s    20k    315k  active 38s ago
     │                       gates ○
     │                       verifier ○
     │                       fix-up ○
  4  │   · 104   pending
  5  │   · 105   pending
  6      · 106   pending                    104
  7      · 107   pending                    105 106
  8  │   · 108   pending
  9  │   · 109   pending
 10  │   · 110   pending
 11  │   · 111   pending
────────────────────────────────────────────────────────────────────────────────────────────────────────────────────────
09:20  #103  started · python-specialist
09:24  #103  specialist running · 4m · 20k new · 315k cache · active 38s ago
The run line and the table come from the snapshot of status (see the snapshot), drawn again at each poll:
- The run line gives the short run id, the state, a bar of 16 cells, the percentage, the tickets that ended, the time used, the ETA, and the two token counts. The ETA is the time from now, or
-before the first ticket ends. A run that ended or paused shows no ETA. While a unit of the run runs and the estimate is 0 or less, the ETA is-. While the verification of aneconomychain runs, its phase comes after the state:running · verifier. - The table has one row for each ticket, flat and in plan order. The columns are
#(the position in the plan), the rail (no header),plan,state,phase,after,used,new,cache, and a live tail with no header. The node glyph inplangives the state:●built,▶running,·pending,✗failed, and–skipped. - The rail and
aftershow the blockers of the plan, fromblocked_byin the plan ofrun-startor of the newestplan-change. When the one blocker of a ticket is the row directly above it, the rail│joins the two rows, andafteris empty. Otherwiseaftergives the id of each blocker: a ticket after a row that is not the row above has no rail, andafternames that row, as66. A join names each blocker, as126 132. The depth of the plan never makes the table wider: a chain of 40 tickets has the columns of a chain of 3. A journal of an earlier version of the engine records no plan, and then no row has a rail or anaftercell. - The row of a running ticket gives its first phase, and each further phase is a sub-row under it, with only the rail, the phase and a detail in the live tail. The rail runs through the sub-rows when the next row has it. A phase shows
✓when it is done,●when it runs, and○when it is to come. While a gate runs, the phase gives its count, asgates ● 2/3: the gate that runs, and the gates of the stack. The count shows when the journal holds an earlier run of the gates of the same stack that ended. A fix-up round shows its round and the limit, asfix-up ● 1/2. Ineconomymode a ticket has the phasesspecialistandgatesonly. Only phases go in thephasecolumn. - The live tail of the row of a running ticket gives the liveness of its agent. While a gate runs, the sub-row of its phase gives
gate <name> · log <time> agoin its live tail. After a gate log has no change for the stall time, the tail gives⚠ idle <time>. The stall time is--stall-minutes, or 5 minutes. After a continuation, the tail starts withcont <count>/<limit>. - In
economymode, the table has a chain row under the last ticket of each stack that started its verification. It gives the stack, the state, the phase, the time used, and in its live tail the gate that runs or the activity of the verifier. - The live tail of a ticket that failed or was skipped gives the reason, with no path. The reason of a crash in a journal of version 1.19.2 or earlier ends with
(traceback <name>), where<name>is the name of the file of its traceback only. While the run ispausing, the live tail of the next row givespauses before this step: the first pending ticket after the running ticket, or the first pending ticket when no ticket runs. In a paused run, the live tail of the ticket that the pause stopped before givespaused before this step,paused before the gateorpaused before the verifier. - For a run with no stream reader, the table has no columns
newandcache, and the live tail gives no activity.
Each column has the width of its track in the design: # 3 cells, the rail 2, plan 6, state 10, phase 13, after 8, used 7, new 5 and cache 6, so the live tail starts at the same cell for each plan. A column with a value that is wider than its track is as wide as its widest value. The live tail has no track. There are 2 cells between two columns. The numbers, and the headers #, used, new and cache, align right in their track. The bar drops first: on a terminal of fewer than 100 columns, the run line has no bar. When a line of the table, with the live tail of a running ticket, is wider than the terminal, the columns drop in this order: new and cache, then used. The labels of the phases stay, because the phases stack. A reason in the live tail does not make a column drop: the cut at the width of the terminal ends it.
The feed holds only the lines of the ticket that runs now. The step-start of a ticket, or a retry, starts the feed again. So the lines of a ticket that ended, and a problem of it, stay until the next ticket starts. Before the first step, the feed holds the line of the start of the run. A stack-change is a line with no ticket, as stack python changed: gates, gate_timeout. In economy mode, the verification of the chain is one group, and its lines name the stack: stack python verifier started (#a, #b). A line starts with the local time of the event (HH:MM), then the ticket (#<id>), and then what happened. The ticket, or the stack, has a track as wide as the widest of the feed, and at least 3 cells, with 2 cells before and after it. A line with no ticket, as a problem, starts what happened on the track of the ticket. A line shows no path and no None: it shows only the name of a file. The feed joins the events that belong together into one line:
| Line | The events |
|---|---|
#a specialist finished · 36m · tokens 19k new, 980k cache · report ok |
The result of an agent (adapter-result, fixup-result or verify-result) and the event of its report. It gives the role, the end state, the time from its agent-start, and the two token counts of its stream. |
#a gates green (pytest 16m, zensical 1s) |
The gate-result and gate-skip events of one round of gates. Each gate has the short name of its command and its time. The short name is the name that the workflow gives to the gate. A gate with no name has the name of the tool in its command: the first word that is not a launcher (such as nix develop -c or python3 -m), with no version, in the last part of a && or ; chain that is not cd <dir>. So cd frontend && npx vitest run --project unit is vitest. The live view, the gate that runs in the table, and the line of a pause give the gate by the same short name. A red gate has the word red, and a gate that the engine ended at its gate-timeout has the words timed out. |
#a ✓ ACCEPT · built |
A verdict, or the gates, with the step-end that follows them. A REJECT gives the number of findings. |
stack python ✓ ACCEPT · run built · 16m · tokens 39k new, 1.1M cache |
The verdict of the chain of a stack in economy mode, with the run-end that follows it. |
run built · 1h06m · tokens 50k new, 1.3M cache |
The run-end: the result, the time of the run, and its two token counts. |
paused · before ticket d · go on with delegate run --resume ab12 |
The paused event: where the run stopped, and the command that goes on with it, with the short run id. |
halted · the specialist of ticket d · claude: not logged in · go on with delegate run --resume ab12 |
The halted event: where the harness failed, the message, and the command that goes on with the run, with the short run id. |
crashed · the gates of ticket d · EngineError: disk full · traceback crash-41.txt · go on with delegate run --resume ab12 |
The crashed event: where the crash stopped the run, the type and the message of the exception, the name of the file of its traceback, and the command that goes on with the run, with the short run id. |
The events agent-start, gate-start, idle-timeout, agent-timeout, run-branch-advance, lock-broken and pause-requested have no line of their own. Each other event has a short line. While an agent runs, the last line of a frame tells it, as 16:58 #70 verifier running · 2m · 43k new · 1.1M cache · quiet 2m20s. The line gives the role, the time from its agent-start, the two token counts of its stream in faint text, and the liveness of the agent. A stream that the harness has not opened yet has 0 tokens. For a run with no stream reader, and for a stream that cannot be read, the line has no token counts. The last frame has no such line.
A problem and a stall are lines that start with ✗. For example, 16:36 ✗ #a the specialist returned no valid result: report missing: a.specialist.json, or 17:40 ✗ stall · no change for 30m. The line of the time limit is <time> time limit · <N>m used · the run goes on.
The figure below is a frame after a REJECT. The verifier of ticket 103 gave 2 findings, and the fix-up round 1 of 2 runs. The phase column gives fix-up ● 1/2, and the feed gives the verdict and the start of the round. The text under the figure is the same frame with no colour.
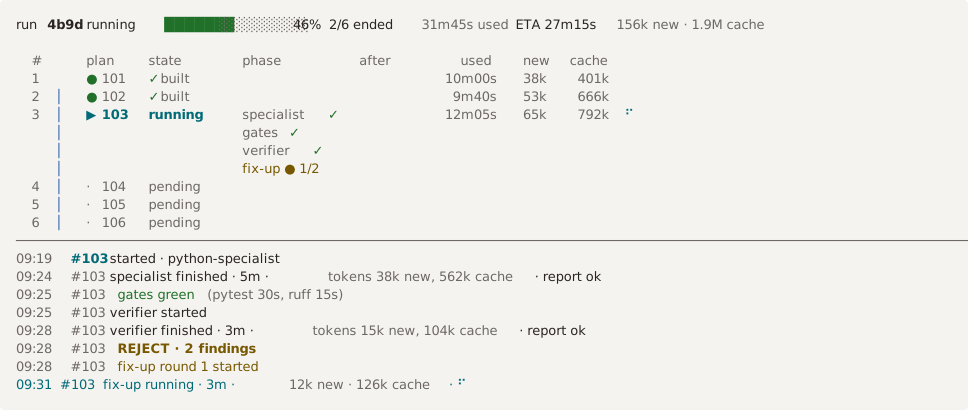
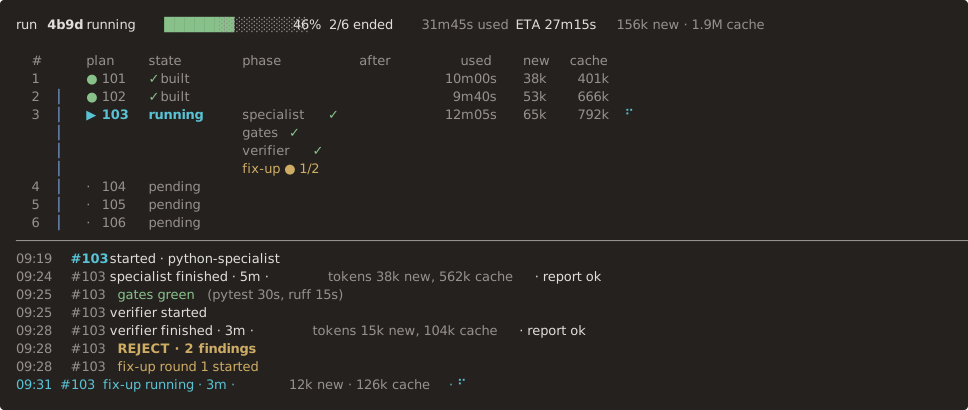
run 4b9d  running  ███████░░░░░░░░░ 46%  2/6 ended  31m45s used  ETA 27m15s  156k new · 1.9M cache

  #      plan    state       phase          after        used    new   cache
  1      ● 101   ✓ built                               10m00s    38k    401k
  2  │   ● 102   ✓ built                                9m40s    53k    666k
  3  │   ▶ 103   running     specialist ✓              12m05s    65k    792k  active 25s ago
     │                       gates ✓
     │                       verifier ✓
     │                       fix-up ● 1/2
  4  │   · 104   pending
  5  │   · 105   pending
  6  │   · 106   pending
────────────────────────────────────────────────────────────────────────────────────────────────────────────────────────
09:19  #103  started · python-specialist
09:24  #103  specialist finished · 5m · tokens 38k new, 562k cache · report ok
09:25  #103  gates green (pytest 30s, ruff 15s)
09:25  #103  verifier started
09:28  #103  verifier finished · 3m · tokens 15k new, 104k cache · report ok
09:28  #103  REJECT · 2 findings
09:28  #103  fix-up round 1 started
09:31  #103  fix-up running · 3m · 12k new · 126k cache · active 25s ago
The figure below is the frame of a paused run. The pause stopped the run before the step of ticket 104. Its row gives paused before this step, and the last line of the feed gives the command that goes on with the run. The text under the figure is the same frame with no colour.
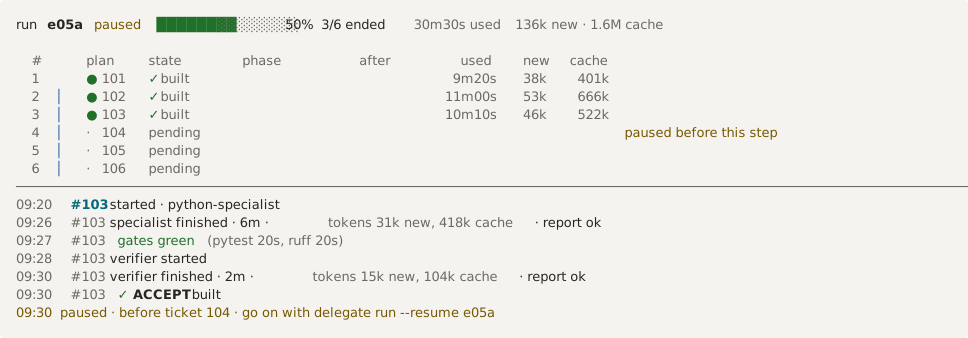
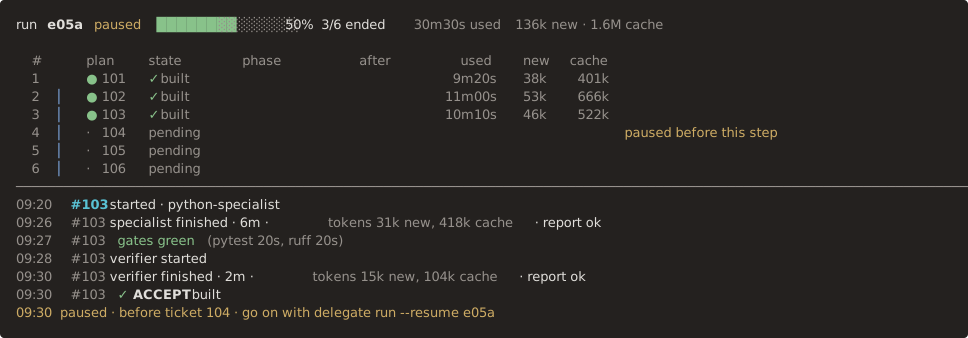
run e05a  paused  ████████░░░░░░░░ 50%  3/6 ended  30m30s used  136k new · 1.6M cache

  #      plan    state       phase          after        used    new   cache
  1      ● 101   ✓ built                                9m20s    38k    401k
  2  │   ● 102   ✓ built                               11m00s    53k    666k
  3  │   ● 103   ✓ built                               10m10s    46k    522k
  4  │   · 104   pending                                                      paused before this step
  5  │   · 105   pending
  6  │   · 106   pending
────────────────────────────────────────────────────────────────────────────────────────────────────────────────────────
09:20  #103  started · python-specialist
09:26  #103  specialist finished · 6m · tokens 31k new, 418k cache · report ok
09:27  #103  gates green (pytest 20s, ruff 20s)
09:28  #103  verifier started
09:30  #103  verifier finished · 2m · tokens 15k new, 104k cache · report ok
09:30  #103  ✓ ACCEPT · built
09:30  paused · before ticket 104 · go on with delegate run --resume e05a
Each part of the frame has the colour of its role, from the 16 ANSI colours of the theme of the terminal: green for a result that is good (✓, ● built, gates green, the done phases, the bar), cyan for the ticket that runs now, yellow for REJECT, a fix-up, a continuation, a pause and ⚠ idle, red for a failure, a problem and gates red, and blue for the rail and the ids in after. Faint text (SGR 2) is for the facts to read second: the times, the tokens, the header, the divider, and the rows that ended or are pending. Bold marks the short run id, the ticket that runs now, the verdict word, and the result of the run. The view sets no background colour. Each state also has a glyph or a word, so the view reads the same with no colour. When NO_COLOR is set and not empty, the frame has no SGR code. When the locale is not UTF-8 (LC_ALL, LC_CTYPE, LANG), the run line, the table, the divider and the glyph of a problem line use the ASCII glyphs + x > . * o - # . | - !, in the same columns. The ids in after stay as they are. The lines of the feed and the title keep the separator ·.
The view hides the cursor with its first frame (ESC [ ? 25 l), so the reader does not see the cursor move down the screen. It writes each frame as one synchronized update: the frame starts with the sequence that begins a synchronized update (ESC [ ? 2026 h) and ends with the sequence that ends it (ESC [ ? 2026 l). A terminal that knows the sequences shows the whole frame at once, also when the frame comes in parts, as over SSH, and a terminal that does not know them ignores them. The view shows the cursor again (ESC [ ? 25 h) at each end of the watch, before its last line: the end of the run, a pause, a halt, a crash, a stall, a time limit, --until verdict, Ctrl-C, SIGTERM, SIGHUP, and an error. --raw, --json and a standard output that is not a terminal get none of these sequences.
The view writes only the lines that changed. It keeps the lines of the frame that it drew last, and the size of the terminal. When the new frame has the same lines, it writes nothing: while an agent runs, the spinner is the only line that changes at most draws, so a draw writes only the one or two lines of the spinner. When the size of the terminal is the same, it writes for each changed line the sequence that moves the cursor to that line (ESC [ <line> ; 1 H), the line, and the sequence that clears to the end of the line (ESC [ K). It then moves the cursor to the line after the frame, and, when the new frame has fewer lines, clears the screen below that line (ESC [ J). Each write is one synchronized update. When the size of the terminal changed, on the first frame, when the terminal gives no height, and for a last frame that is taller than the terminal, the view draws the full frame. Thus a watch over SSH sends little for each draw, and the screen does not flicker.
The view cuts each line to the width of the terminal. A frame fits the height of the terminal, with the last line free for the cursor. The table gets the rows that are left after the run line, the blank line, the header, the divider and 4 lines of the feed. When the plan has more rows than that, rows fold:
- The rows show from the top, in plan order, and the rows of the tail fold into one last row, directly above the divider. The row gives the count and the state of the folded tickets, as
· 13 pending, the range of their ids inafter, as126–144, and the range of their rows, asrows 28–40 folded. - When the tail fold does not keep 3 rows after the running ticket (or each row after it), the rows in the middle also fold into one row. The first 3 rows and the 3 rows before the running ticket stay. The fold row gives
✓ <count> built, the range of the ids inafter, the sums ofused,newandcache, and the range of the rows in the live tail, asrows 4–20 folded. A fold of one row saves no row, so a fold holds 2 rows or more. The rail runs through it when the row under it has the rail. Then the rows after the running ticket show, the nearest first, as many as fit, and the rest fold into the tail.
The rows of the running ticket and its sub-rows never fold. When no ticket runs, the ticket that the pause stopped before, or else the first pending ticket, takes its place. When a fold holds tickets in more than one state, it gives the count of each state, as ✓ 15 built, 1 failed, 1 skipped. With the ASCII glyphs, a range is 104-120. The example below is a plan of 40 tickets on a terminal of 120 columns and 24 rows, with the ASCII glyphs:
run a41f  running  #########....... 59%  23/40 ended  3h56m used  ETA 2h44m  908k new . 0 cache

  #      plan    state       phase          after        used    new   cache
  1      * 101   + built                               10m00s    39k       0
  2  |   * 102   + built                               10m00s    39k       0
  3  |   * 103   + built                               10m00s    39k       0
     |   + 17 built                         104-120     2h50m   657k       0  rows 4-20 folded
 21  |   * 121   + built                               10m00s    39k       0
 22  |   * 122   + built                               10m00s    39k       0
 23  |   * 123   + built                               10m00s    39k       0
 24  |   > 124   running     specialist +               6m00s    19k       0
     |                       gates * 2/3                                      gate types . log 4s ago
     |                       verifier o
     |                       fix-up o
 25  |   . 125   pending
 26      . 131   pending                    124
 27  |   . 132   pending
         . 13 pending                       126-144   rows 28-40 folded
------------------------------------------------------------------------------------------------------------------------
19:50  #124  started · python-specialist
19:55  #124  specialist finished · 5m · tokens 19k new, 0 cache · report ok
19:55  #124  gates green (lint 20s)
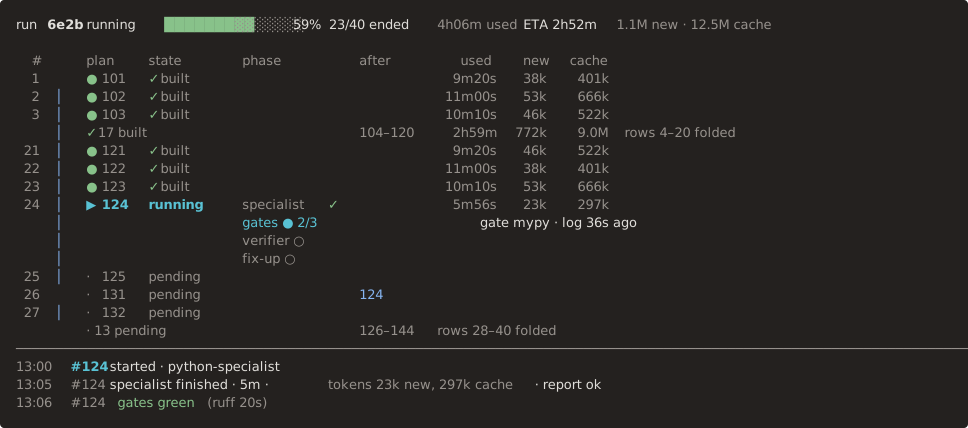
The figure below is a plan of 40 tickets with two branches, on a terminal of 120 columns and 24 rows with a UTF-8 locale. The text under the figure is the same frame with no colour.
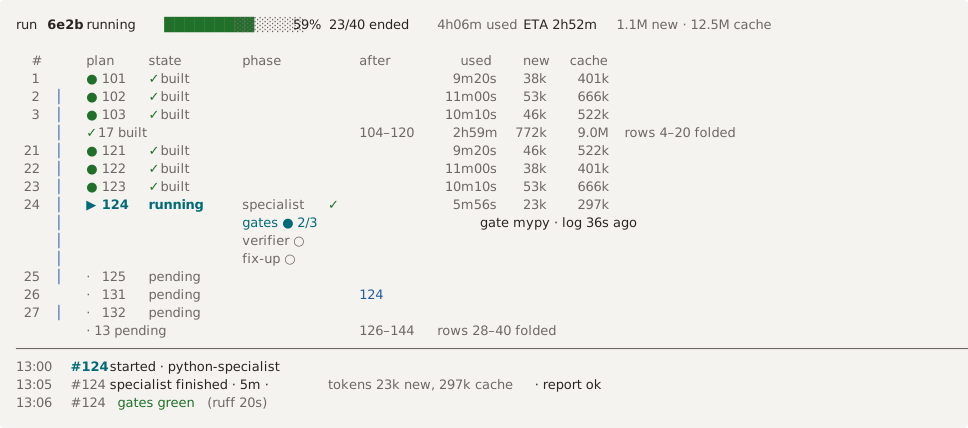
run 6e2b  running  █████████░░░░░░░ 59%  23/40 ended  4h06m used  ETA 2h52m  1.1M new · 12.5M cache

  #      plan    state       phase          after        used    new   cache
  1      ● 101   ✓ built                                9m20s    38k    401k
  2  │   ● 102   ✓ built                               11m00s    53k    666k
  3  │   ● 103   ✓ built                               10m10s    46k    522k
     │   ✓ 17 built                         104–120     2h59m   772k    9.0M  rows 4–20 folded
 21  │   ● 121   ✓ built                                9m20s    46k    522k
 22  │   ● 122   ✓ built                               11m00s    38k    401k
 23  │   ● 123   ✓ built                               10m10s    53k    666k
 24  │   ▶ 124   running     specialist ✓               5m56s    23k    297k
     │                       gates ● 2/3                                      gate mypy · log 36s ago
     │                       verifier ○
     │                       fix-up ○
 25  │   · 125   pending
 26      · 131   pending                    124
 27  │   · 132   pending
         · 13 pending                       126–144   rows 28–40 folded
────────────────────────────────────────────────────────────────────────────────────────────────────────────────────────
13:00  #124  started · python-specialist
13:05  #124  specialist finished · 5m · tokens 23k new, 297k cache · report ok
13:06  #124  gates green (ruff 20s)
Then the feed gets the rows that the table does not use, and keeps its newest lines. When the terminal does not give its size, no row folds, and the frame keeps each line of the feed. The last frame keeps the whole feed, and the terminal scrolls it. Then watch prints the line position <seq>.
The liveness of an agent
The live tail of the row of a running ticket, and the end of the line of its agent in the feed, show the liveness of the agent: the time since its last activity. On a terminal with colour, the liveness has three states:
| Time since the last activity | The liveness |
|---|---|
| Less than 30 seconds | A spinner in cyan. Its frames are ⠋ ⠙ ⠹ ⠸ ⠼ ⠴ ⠦ ⠧ ⠇ ⠏, one step in approximately 125 ms. |
| From 30 seconds to the stall time | quiet <time> in faint text, with no animation. An agent can be quiet during a long test run. |
✗ #a the step continued 2 times (limit 2, trigger gates-red) |
A problem, in the warning colour (yellow), with the same text as the raw line watch: problem. It has no ticket track: its text starts on the track of the ticket, as the line of any event with no ticket. It comes after the line of the result of an agent, when the problem is that result. The run goes on. |
| The stall time or more | ⚠ idle <time> in the warning colour. |
A problem never ends the live view. The row of the ticket of the problem keeps the warning mark ⚠ at the start of its live tail, in the warning colour, until the next event of that ticket. The live view ends only at run-end (exit 0 for built, 1 for failed or abandoned), paused (7), halted (8) and crashed (8), and at the limits that a person sets: --until verdict, --stall-minutes, --max-minutes, and Ctrl-C (130). A halted or crashed run process does not go on without a resume, so halted and crashed end the watch as paused does. The --follow option has no effect on the live view, which always follows the run.
The stall time is --stall-minutes, or 5 minutes. With a locale that is not UTF-8, the frames of the spinner are the ASCII characters |, /, - and \. The spinner turns only while the agent is active, so a spinner that stops does not hide an agent that hangs. Between two reads of the journal, watch draws the frame again from the snapshot that it has, so the spinner turns. The time between two reads of the journal does not change.
With NO_COLOR set, there is no animation. Before the stall time, the liveness is active <time> ago, as in a snapshot: for example, active 38s ago is 38 seconds after the last activity, not 38 seconds of activity. The text under each figure of the live view on this page has this form. The run picker and the status line entry of the Claude Code plugin (plugins/claude-code/) are snapshots, so they also show active <time> ago.
The raw lines
When standard output is not a terminal, or with --raw, watch prints one line for each event. A line has the position (seq), the time, the event name, and then each field of the event that is not a list or an object, as name=value. The field output_tail is not printed. When a problem, a verdict, a stall or the time limit ends the watch, watch prints the reason on a line that starts with watch:. With --follow, a problem ends no watch, but watch still prints its line watch: problem: ... after the line of the event. At run-end and at paused, the line of that event is the last event line. Then watch prints the line position <seq>. An error and Ctrl-C give no line position <seq>.
The JSON lines
With --json, watch prints each event that it reports as one JSON object on one line. The object is the event as the journal holds it, with the fields that the journal table gives, and with the field output_tail too. An event at or before --from is not printed. The exit codes are the same as for the other forms.
When the watch ends for a reason of its own, watch prints one last object after the last event:
reason |
The watch ended because | exit_code |
|---|---|---|
problem |
An event is a problem, and --follow is not set. |
3 |
verdict |
--until verdict is set and the journal holds a verdict event. |
4 |
stall |
--stall-minutes is set and nothing changed for that time. |
5 |
time-limit |
--max-minutes is set and the time is used. |
6 |
The run itself ends the watch at run-end, paused, halted and crashed. Then the last object is that event, and there is no watch-end object: the exit code is the code of the result. An error and Ctrl-C also give no watch-end object. With --follow, a problem is an event like any other: the watch goes on, and a later end of the run, not the problem, gives the last line.
Standard output holds JSON objects only. So --json prints no line position <seq>, no run picker, no live view and no title of the terminal: each object has its seq, and --from <seq> goes on after it. With more than one active run, --json never asks: it prints the names of the active runs on stderr and exits 2, as for a standard output that is not a terminal. With no run id, no active run and no --from, --json replays the journal of the newest run, and does not print the one line of the newest run. A newest run that stopped with no pause and no halt, and a newest run that failed at start, have no events to follow: --json prints their line on stderr and exits with the same code as the other forms.
For example, this command prints the seq and the name of each event, and the last object of a watch that a reason of its own ended:
Exit codes
| Code | Reason | When |
|---|---|---|
| 0 | run succeeded | The journal holds run-end with the result built. |
| 1 | run failed | The journal holds run-end with the result failed or abandoned, or, with no run id, the newest run failed at start when no run is active. |
| 2 | error | A usage error, a repository with no run, an unknown run id, a journal that is not valid, a --from position beyond the end of the journal, the journal holds setup-problem: the check of the setup stopped the run, or, with no run id, a newest run that stopped when no run is active, or more than one active run when standard input or standard output is not a terminal, or no answer at the prompt. |
| 3 | problem | An event is a problem, in the raw lines and the JSON lines, and with no --follow. The live view never ends at a problem. See the problem events. |
| 4 | verdict | --until verdict is set and the journal holds a verdict event. |
| 5 | stall | --stall-minutes is set and nothing changed for that time. |
| 6 | time limit | --max-minutes is set and the time is used. |
| 7 | run paused | The journal holds paused: a pause request stopped the run at a step boundary. |
| 8 | run halted or crashed | The journal holds halted or crashed: a failure of the harness or a crash stopped the run. See the halt and the crash. |
| 130 | interrupted | Ctrl-C stopped the watch. The run goes on. See Ctrl-C. |
Code 2 is also the code that argparse gives for a usage error.
watch checks the events in order. The first event that gives a reason ends the watch. In the raw lines and the JSON lines, with no --follow, a problem is such a reason, so a run that failed exits 3 at the first problem that the run did not go past, and not 1. The code 1 follows when watch goes on from the position of that problem. In the live view, and with --follow, a problem is no reason: only the end of the run (run-end, paused and halted) and the limits that a person sets (--until verdict, --stall-minutes, --max-minutes and Ctrl-C) end the watch. This rule is for a run that watch follows or replays. With no run id, the newest run that ended exits with the code of its result, the newest run that stopped exits 7 or 2, and the newest run that failed at start exits 1.
A run that ended and was resumed has a resume event after its old run-end. The events before the first resume after its newest run-end that a resume follows are the history of the run: watch prints them, but a problem, a verdict for --until verdict, or a run-end there does not end the watch. A run that stopped with no run-end and was resumed has no such history, so a problem before its resume still counts, when the run did not go past it. watch then follows the resumed run to its new run-end.
The replay is the events that the journal holds when watch starts. In the raw lines and the JSON lines, a problem in the replay ends the watch only when the run did not go past it. The run went past a problem when any later event of the replay follows it, whatever the event is: a watch that starts again with no --from then follows the active run, and does not stop at an old problem. A problem that is the newest event of the journal is gone past by no event, so it still ends the watch. watch shows a problem that the run went past as history: the feed gives the line of its event, and the watch goes on. The raw lines are the same, and watch prints no line watch: problem. For example, the specialist of a ticket ends failed with the exit status 143, a continuation follows, and the step ends built: watch follows the run that goes on, and does not exit 3. A second continuation that a session, a gate and a verdict of the same ticket follow is a problem that the run went past, so a watch that starts then follows the run too. The rule is the same when the last event of the replay is a run-end or a paused, and the run is at its end. That last event is the end of the run, and it does not go past a problem. So watch replays a run that ended to its end, past each problem that a later event went past, and exits with the code of the end: 0 for a run-end with the result built, 1 for failed, and 7 for a paused. A problem that only the end follows ends the watch with the code 3. For example, when a step fails, its step-end goes past each earlier problem of the step, so watch stops at that step-end, and its reason gives the cause. A problem that arrives after watch starts ends the watch, also when a later event handles it. The live view and --follow have no such end: they show the problem and go on.
A paused event ends the watch with the code 7: a pause request stopped the run process at a step boundary. See the pause. A halted event ends the watch with the code 8: a failure of the harness stopped the run process. See a failure of the harness. A crashed event ends the watch with the code 8 too: a crash stopped the run process, and a resume goes on with the open step. See a crash in a step. A paused, a halted or a crashed that another event follows, for example the resume of the run, is history, and it does not end the watch.
The problem events
A problem is one of these events. The raw line watch: problem: ticket <id>: <reason> names the ticket and the reason.
| Problem | The event | Reason in the line |
|---|---|---|
| A step ends blocked or partial | report-validation or fixup-report with a status other than committed |
the step ended <status>: <blocked_reason> (report-validation), or the fix-up specialist ended <status>: <blocked_reason> (fixup-report). With no blocked_reason, the reason stops after <status>. |
| A step ends with gates that are not green | step-end with the state failed and no traceback, when the newest result of a gate command of the ticket is red |
the gates are not green: <commands>. A gate that the engine ended at its gate-timeout has (timed out) after its command. |
| An agent session runs past its time limit | agent-timeout |
the <role> session ran past the agent-timeout of <n> minutes. The <role> is specialist, fix-up or verifier. The result event that follows adds no second problem. |
| An agent fails | adapter-result, fixup-result or verify-result with the end state failed, or (for a fix-up specialist and a verifier) the end state capped |
the <role> ended <end state> with exit status <n> |
| A permission mode refused a tool | adapter-result, fixup-result or verify-result with a refused field |
the <role> was refused <tools> in <mode> mode; give the agents a settings file with DELEGATE_AGENT_SETTINGS |
| An agent returns no result | report-validation, fixup-report or verify-report with valid false |
the <role> returned no valid result: <reason> |
| A second continuation of a step | continuation with a count of 2 or more |
the step continued <n> times (limit <n>, trigger <trigger>) |
| A step fails for any other reason | step-end with the state failed, and no red gate |
the step failed: <reason> |
| A step crashed, in a journal of version 1.19.2 or earlier | step-end with the state failed and a traceback |
the step failed: <reason> (traceback <path>). The file at <path> holds the traceback. A crash now writes crashed, which is no problem: it ends the watch with the code 8. |
A specialist that ends capped continues, so it is not a problem. The first continuation of a step is also not a problem. A gate that is red and turns green after a continuation is not a problem.
An agent that ends finished with an exit status other than 0 is not a problem at its result event. With a valid report, the step continues. Without a valid report, the next report event or the step-end gives the problem. An agent that delegate run ended at the idle timeout is also not a problem. The journal records idle-timeout before its result event, and watch does not check that result event. An agent that delegate run ended at the agent-timeout of its stack is a problem at the agent-timeout event, as the table says, and watch does not check its result event either. A continuation or a retry goes past that problem as it goes past any other. See the end of an agent session.
In the feed, the result line of such an agent says timed out in the place of the end state, as #a specialist timed out · 10m. In delegate status, the reason of a failed ticket names the limit: the verifier session ran past the agent-timeout of 10 minutes, or gates red: pytest -q (timed out).
The verdict
With --until verdict, watch exits at the first verdict event that is not history: a verdict before the resume of a run that ended, or a verdict of a ticket that a later retry of that ticket follows, does not end the watch. The raw line is watch: verdict: ticket <id> round <n>: <verdict>: <findings>. For the verdict of a chain in economy mode, the raw line is watch: verdict: stack <name> (tickets <ids>) round <n>: <verdict>: <findings>. The findings are separated by ;. Without the option, watch goes past each verdict.
The stall
--stall-minutes N compares the time now with the newest modification time of the journal, of the event-stream files that the events name (event_stream), of the gate log files that the events name (gate_log), and of the log files of the prepare commands (prepare_log). If the difference is N minutes or more, watch exits. The raw line is watch: stall: the journal, the event streams and the gate logs have not changed for N minutes; last event: <the line of the last event>. A run that has ended is not a stall.
The journal names the event stream of an agent in agent-start, before the agent starts. While an agent runs, its own stream therefore shows a change too. A tool heartbeat of Claude Code is such a change, so an agent that runs a long command in the foreground is not a stall. For a stream that ends with such events, status uses the same modification time as the newest activity. The journal names the log file of a gate in gate-start, before the gate runs, and the gate runner appends the output of the gate to it. A long gate that writes output is therefore not a stall. A gate that writes no output for N minutes is a stall. A journal of an earlier version names a stream only when the agent has ended: for such a run, set N to more than the longest time of one agent run.
The position
--max-minutes N ends the watch before a harness kills the background task. The raw line is watch: time limit: N minutes are used; the run is not at its end. Each exit after watch follows a run prints position <seq>. Ctrl-C prints the position in its own line, and an error prints no position. See Ctrl-C. watch --from <seq> goes on after that event:
- It prints no event with a position of
<seq>or less, so no event is reported twice. - It reads the earlier events for the problem rules. A step-end after the position still finds the red gate before the position.
- If the journal ended or paused at or before the position, it exits with the result of the run, with 7 for a pause, or with 8 for a halt.
- If the journal holds fewer events than
<seq>, it exits 2.
Ctrl-C
Ctrl-C stops the watch. It does not stop the run. In the live view, SIGTERM and SIGHUP stop the watch in the same way, with the same steps, the same line and the same exit code. watch then does these steps:
- On a terminal, it draws the last frame of the live view, shows the cursor, and sets the title to
delegate watch · <short run id> · interrupted. Thus the terminal is clean also when Ctrl-C comes whilewatchdraws a frame. See the terminal title. - It prints one line on stderr, and no line
position <seq>. See the line below. - It exits with the code 130, as a shell gives for SIGINT. It shows no traceback.
The position is the seq of the last event that watch reported. watch <run id> --from <seq> goes on after that event. See the position. When Ctrl-C comes before watch finds the run, for example at the prompt of the run picker, watch prints delegate: interrupted on stderr and exits 130.
The terminal title
When standard output is a terminal, each delegate command sets the title of the terminal with the OSC 2 sequence: ESC ] 2 ; <title> BEL. The tab of the terminal then shows the command, and not the name of the Python process.
statussets the titledelegate status.watchsets the titledelegate watch · <short run id> · <percent>% · ETA <HH:MM>at each poll. It writes the title again only when the title changes. The percentage is the percentage of the snapshot. The ETA is the local time of the estimated end of the run, or-before the first ticket ends. See the progress and the ETA.- When
watchexits, the title isdelegate watch · <short run id> · <result>. At the end of the run, the result isbuiltorfailed. At a pause, it ispaused, at a halt,halted, and at a crash,crashed. When the watch ends before the run, the result is the reason:problem,verdict,stall,time limitorinterrupted. delegate runsets the titledelegate run · <short run id>. See the output ofdelegate run.- Each other subcommand of
delegatesets the titledelegate <subcommand>, for exampledelegate render.
The short run id is the part of the run id after the last -: abcd for the run id 20261016T030000Z-abcd. A run id with no - is its own short form. A title holds no control character.
A terminal does not show the title sequence as text, so the frames of the live view and the raw lines do not change. watch sets the title also with --raw. watch sets no title when it cannot find the run.
When standard output is not a terminal, delegate writes no title sequence. To turn the title off on a terminal, set the environment variable DELEGATE_NO_TITLE to 1. delegate does not set the title back when it exits. The shell or the terminal can set it again.